

What is a good TMUA score?
The mean for 2026 entry was 4.28 and the median 4.1. So anything above about 4.3 beats the average candidate, 5.3 puts you in the top quarter, and 6.7 in the top tenth. What counts as good, though, depends on the course rather than the test.
Written by the specialists behind our practice bank — over a decade writing, teaching and tracking the UK admissions tests.
What the numbers actually are
UAT-UK publish a technical report for the TMUA every year, and it contains the full score distribution. The current edition is the TMUA Technical Report 2025-26, whose cover page reads "Published July 2026".
These are the numbers that answer "where did I come", and they are free. Every figure on this page is linked to the document it came from, so you can check any of it.
Here's how that breaks down:
| Source | What it gives |
|---|---|
| TMUA Technical Report 2025-26 | 2026-entry distribution (Table 4), reliability and standard error (Tables 16 and 17), and the scaling anchors (Table 2) |
| TMUA Technical Report 2024-25 | The same figures for 2025 entry |
| UAT-UK results page | The scale, the Rasch method, appeals, and how results reach universities |
| UAT-UK annual reports index | Where both reports live, and where next year's will appear |
| Sitting | Candidates | Mean | 25th | 50th | 75th | 90th |
|---|---|---|---|---|---|---|
| All, 2026 entry | 16,092 | 4.28 | 3.0 | 4.1 | 5.3 | 6.7 |
| October 2025 | 9,685 | 4.62 | 3.3 | 4.5 | 5.8 | 7.0 |
| January 2026 | 6,407 | 3.78 | 2.7 | 3.6 | 4.6 | 5.9 |
| All, 2025 entry | 13,855 | 4.20 | 2.9 | 4.0 | 5.2 | 6.5 |
| October 2024 | 8,987 | 4.58 | 3.3 | 4.5 | 5.7 | 7.0 |
| January 2025 | 4,868 | 3.51 | 2.4 | 3.3 | 4.4 | 5.4 |
Three design facts explain the shape of that table, and they matter for reading it.
The scale runs from 1.0 to 9.0, to one decimal place, and is capped at both ends.
The median is fixed at 4.5 by design, not measured. UAT-UK set the October median to 4.5 and the October 90th percentile to 7.0, then apply the same conversion to January.
Which is why the full-year median comes out at 4.1 rather than 4.5. The anchor is set on October alone, and January pulls the combined figure down.
The full mechanism, including how the scaling actually works, is on the scoring and results guide.
If you want to know what a raw mark on a past paper is worth against these numbers, that guide also carries our TMUA score conversion table, and the figure behind it: about four raw marks out of 40 per scaled point.
"Good" depends on the course, not the test
The percentiles above tell you where you came. They do not tell you whether you got in, and the difference matters.
There is no pass mark and no fail. The universities say so directly.
The TMUA is a ranking instrument. It exists to separate candidates who all have top grades, and each university decides for itself where to draw a line, or whether to draw one at all.
So a 6.0 might be comfortably enough for one course and mid-field for another in the same building.
It is also only one input. Universities use the score alongside your predicted grades, personal statement, reference and, at Oxford and Cambridge, an interview.
Which means the honest answer to "is 5.8 a good score" starts with a question back: good for what?
If you have not yet worked out whether your course even requires the test, start with the complete TMUA guide rather than a target number.
The only two published thresholds
Of the seven institutions using the TMUA, exactly two publish anything that resembles a number. Both caveat it themselves.
Warwick
Warwick state that in the last admissions cycle, 2025 entry, the majority of offers were made to applicants with a TMUA score of 5.0 and above.
Read the wording carefully, because it is doing careful work.
That is a description of what happened, not a requirement. "The majority of offers" leaves room for offers below 5.0, and Warwick say separately that the exact requirement will not be published.
It is also 2025-entry data, which Warwick flag themselves. A cohort that grew by 16% the following year is not guaranteed to behave the same way.
Durham
Durham's is the more useful of the two, because it is a published mechanic rather than an observation.
A score of 5.0 or above makes you automatically eligible for a reduced offer, one grade below the standard requirement.
Below 5.0, a score still counts. Durham treat it as positive evidence down to a floor set each year, which they say can be between 3.2 and 3.5.
That second half is the part almost nobody reports, and it changes the decision for a lot of candidates.
What everyone else publishes, which is nothing
That leaves five institutions, and it is worth naming them rather than hedging.
Cambridge, Oxford, LSE and UCL publish no TMUA threshold of any kind. No minimum, no typical score, no range.
That is a deliberate position rather than an oversight. Cambridge state plainly that there is no pass or fail, and a published number would function as one.
There is one partial exception, and it is the most useful primary data any university offers.
Imperial's score dashboard
Imperial publish an anonymised interactive dashboard of admissions test scores and application outcomes, broken down by department.
It shows score distributions as box plots against outcome, so you can see the spread for applicants who were made an offer, invited to interview, or unsuccessful.
You can select your department, and the data is further split by Home, Home widening participation, and Overseas applicants.
Imperial attach a caveat that matters: this is historic data, distributions and outcomes vary year to year, and the scores shown should not be taken as indicative of requirements for the current cycle.
Taken as history rather than as a target, it is the closest thing to an answer that exists.
Your percentile depends on who you sat with
A score is a rank, so the same number means something different depending on which sitting produced it.
This is not a quirk. It is the largest single effect in the data, and it is bigger than most of the differences people worry about.
Here's how that breaks down:
| Percentile | October 2025 | January 2026 | Gap |
|---|---|---|---|
| 25th | 3.3 | 2.7 | 0.6 |
| 50th, the median | 4.5 | 3.6 | 0.9 |
| 75th | 5.8 | 4.6 | 1.2 |
| 90th | 7.0 | 5.9 | 1.1 |
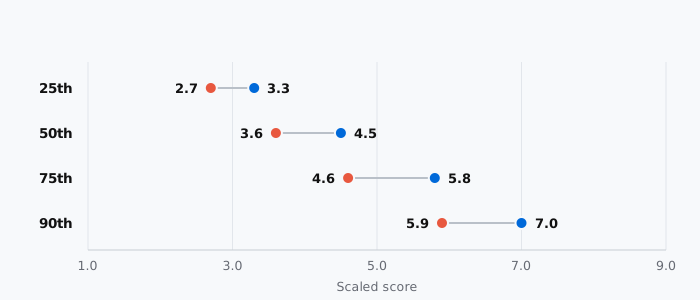
Read the bottom row. A 5.9 put you in the top 10% of the January cohort.
The same score sat around the top 25% in October.
The gap widens as you go up the scale, which matters most to exactly the candidates who care most about it.
Two things this does not mean, both worth being clear about.
It does not mean January is easier. The scaling applied to both sittings is identical, computed once from the October data. That is the whole point of equating.
A 5.9 in January and a 5.9 in October represent the same measured ability. What differs is how many people around you scored near it.
It does not mean you should pick January to look better. Universities see your score, not your percentile within a sitting, and they know when you sat.
What it does mean is that percentile talk needs a cohort attached. "Top 10%" is meaningless without saying top 10% of what.
The likeliest explanation is who sits when. Oxford and Cambridge applicants must sit in October, which loads that cohort with candidates applying to the most competitive mathematics courses in the country.
But the cause is not established in any published source, and we are not going to invent one.
What a good score looks like at a real university
Universities publish almost nothing. But they are public authorities, so people ask them under the Freedom of Information Act, and the answers are published.
That is where the actual numbers live. Below are four responses, each linked, covering Cambridge, Warwick and LSE.
Read the caveats first, because they change what these figures mean.
Cambridge: Economics and Computer Science
Cambridge released TMUA scores for every college, split by applicants and offer holders, for both courses in the 2025 apply year.
The headline is the gap between the two groups.
Here's how that breaks down:
| Course | Applicants | Offer holders | Difference |
|---|---|---|---|
| Economics (L100) | 4.66 | 5.99 | +1.33 |
| Computer Science (G400) | 4.55 | 6.60 | +2.05 |
So at Cambridge, the typical successful applicant scored around 6.0 for Economics and 6.6 for Computer Science, against a national median of 4.1.
That is roughly the top 15 to 25% of the whole cohort, which is about what you would expect for two of the most competitive courses in the country.
The applicants are a different story. Both courses average close to 4.6, which is where the October cohort as a whole sits.
Applying to Cambridge does not put you in a stronger field on this test, and everything that separates the two rows above happens at the offer stage.
Now the part that is more interesting than the averages.
| Economics | Computer Science | |
|---|---|---|
| Lowest college offer-holder average | 4.65 | 5.40 |
| Highest college offer-holder average | 7.41 | 8.70 |
| Lowest score of any offer holder | 3.8 | 3.8 |
Somebody got an offer for Cambridge Economics with a 3.8. Somebody got one for Computer Science with the same.
Both are below the national median.
At the other end, Christ's College Computer Science offer holders averaged 8.7, with the lowest at 8.0. Different colleges, same course, same year.
The college you apply to is not a strategy, because applicants are pooled and moved between colleges. But it does mean any single "Cambridge needs X" figure is hiding a range of nearly five points.
Warwick: fourteen courses
Warwick published minimum, maximum and average TMUA scores for applicants and offer holders across its courses.
The pattern is completely different from Cambridge's, and it is the most useful thing on this page for most readers.
| Course | Applicants | Offer holders | Difference |
|---|---|---|---|
| Mathematics | 5.56 | 5.92 | +0.36 |
| Mathematics MMath | 5.51 | 5.75 | +0.24 |
| Discrete Mathematics MEng | 5.33 | 5.58 | +0.25 |
| Discrete Mathematics | 4.86 | 5.16 | +0.30 |
| MORSE | 4.84 | 4.86 | +0.02 |
| Computer Science MEng | 4.33 | 4.75 | +0.42 |
| MMORSE | 4.56 | 4.55 | −0.01 |
| Computer Science | 4.11 | 4.45 | +0.34 |
| Data Science | 3.98 | 4.09 | +0.11 |
| Economics | 3.88 | 3.93 | +0.05 |
| Computer Science with Business Studies | 3.26 | 3.51 | +0.25 |
| Economics and Management | 2.98 | 3.03 | +0.05 |
| Economics, Politics and International Studies | 2.59 | 2.66 | +0.07 |
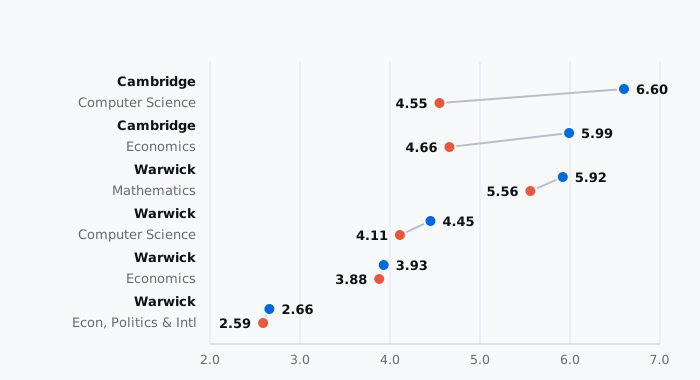
Two things leap out.
The gap between applicants and offer holders is tiny. At Cambridge it was well over a point.
At Warwick it is typically a third of a point, and on one course it is negative.
Warwick's offer-holder minimum was 1 or 1.1 on almost every course. That is the floor of the scale.
People with the lowest possible TMUA score received offers.
Notice also how the courses sort themselves. Warwick's compulsory courses sit at the top, Mathematics highest at 5.92.
The recommended ones sit far lower, with Economics, Politics and International Studies at 2.66.
That is not because those courses are easier. It is because on a recommended course, many applicants take the test speculatively and a weak score does not stop an offer.
Which puts Warwick's own published line in context. They say the majority of 2025-entry offers went to applicants scoring 5.0 and above, and that is compatible with these figures for Mathematics but clearly not for every course on the list.
LSE: and the applicants with no score at all
LSE released application and offer counts alongside the mean TMUA score of offer holders for three mathematics and economics degrees.
| Course | Applications | Offers with a TMUA | Offers with no TMUA | Mean TMUA of offer holders |
|---|---|---|---|---|
| BSc Mathematics with Economics | 387 | 48 | 29 | 7.4 |
| BSc Financial Mathematics and Statistics | 497 | 36 | 27 | 6.9 |
| BSc Mathematics and Economics | 769 | 69 | 25 | 6.6 |
Those means are the highest anywhere on this page. 7.4 sits above the 90th percentile of the entire national cohort.
But read the two offer columns together, because they carry the more important finding.
The honest reading is that a strong TMUA helps at LSE and a missing one is survivable. What would be a mistake is sitting it, scoring poorly, and assuming the score is the reason for an outcome.
What all four datasets say together
Put side by side, they say something more useful than any single target number.
The score that matters depends entirely on the course. An offer-holder average of 6.6 at Cambridge Computer Science and 2.66 at Warwick EPAIS are both real, in the same year, on the same scale.
Nowhere is there a cut-off. Cambridge made offers at 3.8. Warwick made them at 1. Every dataset here has offer holders scoring below the national median.
Compulsory courses show a real gap, recommended ones barely any. Where the test is required and the course is competitive, offer holders score well above applicants. Where it is optional, the two groups look almost identical.
A high score is an advantage, not a qualification. The consistent story across all four is that the TMUA moves your odds rather than deciding them.
So the practical target is still the one from further up this page: clear 5.0 comfortably, and if you are aiming at Cambridge, Imperial or LSE for a mathematics or economics course, aim closer to 6.5 or above on the evidence here.
And treat every one of these numbers as history rather than as a hurdle, because that is what the universities themselves say about their own data.
Why the numbers you have seen are probably wrong
Search for a TMUA target score and you will find confident figures. Most of them fail one of two tests.
They are from before the 2024 scale reset
When UAT-UK took over for October 2024, the scale was rebuilt. Scores from before that point are not on the same scale as scores today.
Durham publish the only stated equivalence: a 2023 score of 6.5 equates to 5.0 today. A 1.5-point shift.
Two further changes sit underneath that.
Scores used to be reported per paper. Under Cambridge Assessment you received a Paper 1 score and a Paper 2 score. Today you get one combined number.
The anchoring changed. The current method pins the October median at 4.5 and the 90th percentile at 7.0. Whatever the old scale did, it did not produce the same mapping, or Durham's two numbers would be the same.
So any forum thread, blog post or target figure from before late 2024 is quoting a currency that no longer exists.
They were never sourced in the first place
The second failure mode is more common and harder to spot.
Only Warwick and Durham have published anything. So a specific figure for any of the other five institutions cannot have come from the university, because the university has never said it.
What usually happened is that someone estimated, someone else repeated it without the hedge, and the third site to publish it presented it as established.
The tell is simple and worth applying to this page too.
Your score is a range, not a point
This is the part that reframes the question, and the data for it is published.
A TMUA score is an estimate, and UAT-UK publish how wide the error bar around it is.
The measure is the standard error of measurement, and the 2025-26 technical report gives it on both scales.
| Sitting | Raw reliability | Raw SEM, of 40 | Scaled SEM, on 1.0-9.0 |
|---|---|---|---|
| October 2025 | 0.85 to 0.88 | 2.58 to 2.71 | 0.62 to 0.64 |
| January 2026 | 0.82 to 0.87 | 2.61 to 2.69 | 0.62 |
The reliability figures are genuinely good. Anything above 0.80 is the conventional threshold and every version of the test cleared it.
The number to sit with is the scaled SEM, at roughly 0.6 of a point.
UAT-UK explain how to read it: there is about a 68% chance your true score lies within one SEM of the score you were given, and about 95% within two.
Three things follow, and they are worth more than any target figure.
Chasing a decimal is not a strategy. The gap between 6.2 and 6.4 sits inside the measurement noise of the instrument.
Universities know this. It is part of why most of them decline to publish a threshold, and why Warwick describe 5.0 as where offers fell rather than as a cut-off.
Aim to be clearly above what you need, not level with it. A score that only just clears a line has an error bar straddling it.
So what should you aim for?
Everything above this point is published data. This section is GhostPrep's advice, and you should weigh it as such.
5.0 is the only number any university has attached a published consequence to. Durham use it for automatic reduced-offer eligibility, and Warwick report it as where the majority of their offers fell.
That makes it the sensible floor to aim past, whichever university you are applying to. It sits just above the national median of 4.1 and comfortably above the 25th percentile of 3.0.
Beyond that, calibrate to how competitive your course is rather than to a number someone published.
And the only way to move where you land is practice. Every official paper is free with worked answers on the past papers page, and tracking your raw mark out of 40 across several of them tells you more than any target figure will.
| Score | Where it put you | Reasonable read |
|---|---|---|
| 6.7+ | Top 10% | Competitive anywhere, including the most selective courses |
| 5.3 | Top 25% | A strong score. Clears Durham's reduced-offer threshold with room |
| 5.0 | Just above the middle | The only published benchmark. Durham's threshold, Warwick's reported level |
| 4.1 | The median | Average for the cohort. Still positive evidence at Durham |
| 3.0 | Bottom 25% | Below Durham's stated floor of 3.2 to 3.5 |
One factor changes where you land, and it is not about ability.
The October cohort scores markedly higher than the January one, by 0.84 of a point in 2026 entry and 1.07 the year before, on a scale built to make the two comparable.
The cause is not established and it does not mean the January paper is harder. But it does change what a given score says about you relative to the people you sat with.
Two last things about the score once you have it.
There are no appeals. UAT-UK do not accept appeals of test scores, and you may only sit once per admissions cycle.
You do not choose who sees it. Results go automatically to participating institutions in your UCAS application, matched course by course.
Frequently asked questions
What is a good TMUA score?
Above roughly 4.3 beats the average candidate, 5.3 puts you in the top quarter and 6.7 in the top tenth, based on the 2026-entry cohort. The only number any university attaches a published consequence to is 5.0.
What is the average TMUA score?
The mean for 2026 entry was 4.28 across 16,092 candidates, and the median 4.1. In October alone the median was 4.5, which is fixed by design rather than measured.
Is 5.0 a good TMUA score?
It is above the national median of 4.1, and it is the threshold Durham use for automatic reduced-offer eligibility. Warwick report that the majority of their 2025-entry offers went to applicants at 5.0 and above. For the most selective courses it would be mid-field.
Is 7.0 a good TMUA score?
Yes. 7.0 was the 90th percentile of the October 2025 cohort, so it puts you in roughly the top tenth of the strongest sitting. It is competitive anywhere.
What TMUA score do I need for Cambridge, Oxford, LSE or UCL?
None of them publishes one. Any specific figure you find for those four did not come from the university, because the university has never stated it.
Is there a pass mark for the TMUA?
No, and no grade boundaries either. Cambridge state there is no pass or fail, and Imperial that there are no grade boundaries or pass marks.
How accurate is a TMUA score?
The standard error of measurement is about 0.6 of a scaled point. So a 6.0 and a 6.5 are not reliably distinguishable, and aiming to be clearly above what you need beats aiming to be level with it.
Are old TMUA score benchmarks still valid?
No. The scale was rebuilt in 2024 and Durham state that a 2023 score of 6.5 equates to 5.0 today. Anything from before late 2024 is quoting a scale that no longer exists.
Does the sitting I choose affect my score?
Not the scaling, which is identical for both. But the January cohort scored 0.84 of a point lower on average in 2026 entry. The cause is not established and it does not mean the January paper is harder.
Can I resit the TMUA if my score is low?
No. One sitting per admissions cycle, and there are no appeals.
Move the number, not the target
The percentiles on this page are free and always will be. What changes where you land in them is practice on the question types you keep getting wrong.
Free to start · 10 practice questions a day · no card required